John ODonnell

A home page to expand on my data science projects. All source code can be found on my GitHub profile!
Please Contact for Resume.
Email: johnodonnell123@gmail.com
Phone: (936) 537 0533
View LinkedIn Profile
Understanding the impact of customer churn
Description: In this post I want to share some of the interesting takeaways I’ve found while investigating customer churn and the impact it has on a subscription business.
What is churn?
A subscriber is said to churn when they cancel their subscription. For example, lets say Hulu had 1 million customers at the beginning of the month, and of that 1 million, 50,000 cancelled their subscription and are no longer customers. These 50,000 customers are said to have “churned”, and the churn rate for this month would be 5%. 50,000 customers feels like a large number, however that is a common churn rate to see in any subscription business.
There are a few things I would like to cover in this post that I have found meaningful:
- Churns and Tenure (how long the average customer remains a customer)
- Churn and LTV (the total lifetime value of each customer)
- Churn and LTV : CAC (an important financial metric for valuing subscription businesses)
- Churn and growth
Churn and Tenure:
Tenure is a commonly used term to describe the amount of time the average customer remains a subscriber. Fortunately, this is an easy metric to calculate and is purely a function of the average churn rate.
- Tenure = 1 / churn rate
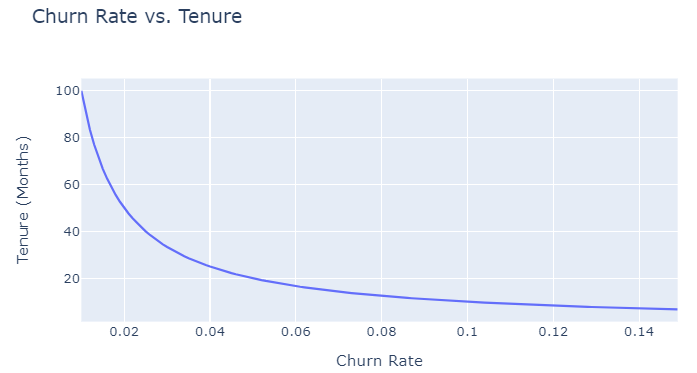
This is interesting, as you can see customer tenure varies to a large degree on the left-side of the “elbow” of the plot from rates of 1-5%, but far less so for rates 5%+. Marginal decrements to churn rate have a much larger impact the smaller the baseline rate. However, it becomes much more difficult to decrease lower amounts of churn as well. It might not be obvious at this point why tenure is so important, so the next relationship we will look at is the Lifetime Value (LTV) of a customer vs. churn.
LTV vs. Churn:
The lifetime value of a user is the total amount of revenue collected from users on average, less the average cost incurred the users. In this example we assume the following values on a monthly basis:
- ARPU: Average Revenue Per User = $50
- COGS: Average Cost Incurred by User = $40
- GP: Gross Profit = $10
- LTV = GP * Tenure
If $10 is the gross profit monthly from each user, and by reducing churn we increase tenure, the LTV of the average customer is raised.
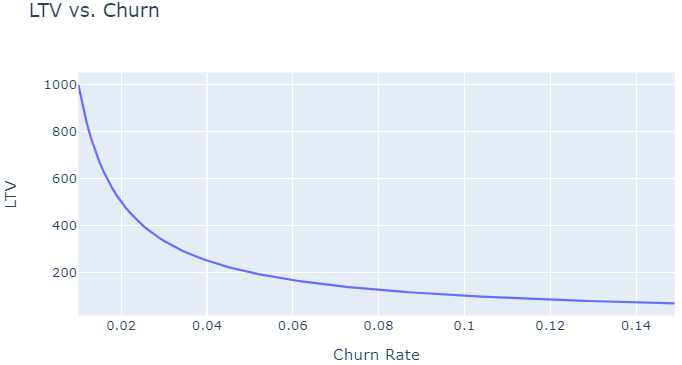
The chart appears nearly identical from the once above. Both represent an inverse/power law relationship, which is interesting. Once again most of the incremental change due to churn is found at the small values of churn rate. Moving from 8% churn to 7% churn raises LTV from $125 to $142, which is an increase of ~ 14%. However, moving from 6% churn to 5% churn raises LTV from $166 to $200, an increase of ~20%. That is a relatively large delta, considering neither of those intervals fall within the “elbow” of the plot where the deltas are the most extreme.
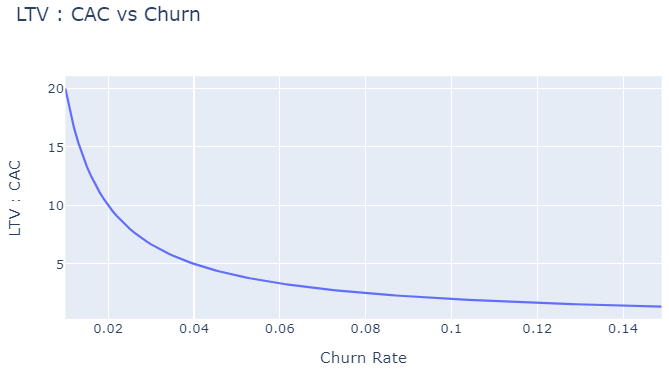
LTV : CAC vs Churn:
An important metric for any subscription business is LTV:CAC, which is the ratio of the lifetime value of the customer to the total cost of acquiring a customer. As you might have guessed, this relationship is a function of churn and therefore is governed by the power law. This is a signal of customer profitability as well of overall efficiency, many healthy growing companies have a values > 3. This means they are spending < 33% of their customers lifetime value to acquire said customer.
Churn and Growth:
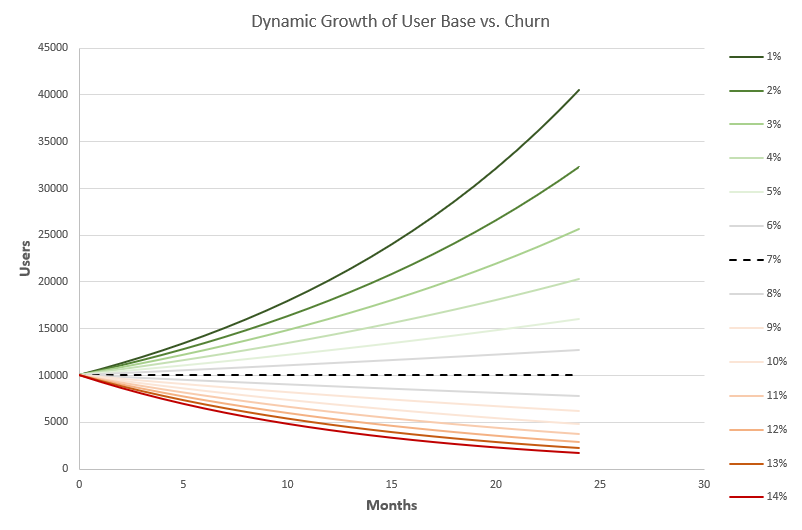
In the plot below the growth of a user base through time is shown for different churn rates. The churn rates range from 1% to 14% and the additional assumptions are seen below:
- User base at time 0 = 10,000 users
- Monthly growth = 700 users/month (note this is a fixed value)
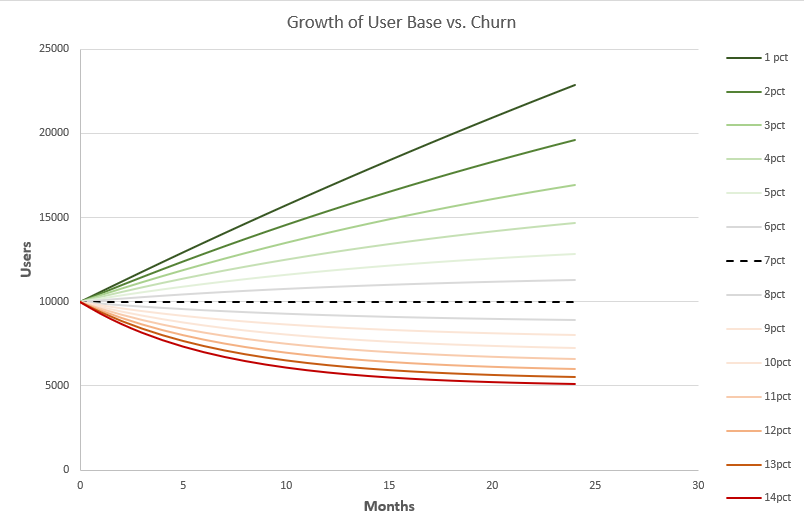
Starting with the most intuitive case, look at the black dotted line which represents 7% churn (or losing 700 users/month). It is flat because our growth is a static addition of 700 user per month, balancing out our gains/losses.
- As we move to higher churn rates and into the warmer colors of the plot, we can see that in the early time (months 0-10) we see large drops in user count from our baseline case, however the relationship appears asymptotic and “dies out” around 5000 users. In fact, we know that the point at which the relationship will stabilize and flatten is when our addition of 700 users/month comprises the exact percentage of our total user base as our churn rate. So, at 15% churn our asymptotic value would be 4,667. So, we would see some decline from 5000, albeit slow
- Moving into the cooler green colors on the plot we can see that the rate of growth in the early time (months 0-10) appears to be similar to the rate of decline previously seen. The difference is that as the churn rate drops the relationship starts to “fan out”, with the lowest churn rate appearing linear and larger churn rates appear more similar to our asymptotic relationship we saw with decline. This is primarily due to the limited scope of the x-axis (24 months). If we extended out the months further we would see all of these eventually flatten. Just as we calculated the asymptote for decline, we can for growth as well. The value for 2% churn would be 35,000 users.
Continued Growth:
The natural question becomes, with the power law creating all of these asymptotes, how do we continue to grow? The answer lies in variable growth which is common in the subscription business due to network effects. This is a term used to describe how the value a user derives from a service grows as the number of total user base grows. When there are more users on a platform the company has more money to improve the quality of the product, advertise more, and user are more likely to advertise for the service for free by word of mouth. It is almost as if the business is gaining momentum. This would take our static monthly growth of +700 users and make that value a function of the user base. For example, let’s assume +7% user base growth per month.
This scheme looks much more favorable now and its clear to see how continued growth can be achieved, especially at lower churn rates!
The takeaway from this post is to better understand the impact of churn on the business as a whole. Having an in depth understanding of churn means understanding your users and your business, allowing for more efficient solutions to be implemented and continued growth.